In Processing, the point (0, 0) is the top-left corner of the window. x grows to the right and y grows downward, so a bigger y moves a shape lower on the screen. This guide covers that grid first, then every common reason to change it: shape modes, mouse input, a y-up math grid, rotation, pixels[] on Retina screens, 3D, polar coordinates and map data.
Key takeaways
- The origin (0, 0) is the top-left corner. The bottom-right pixel is (width-1, height-1).
- rect() is measured from its top-left corner by default and ellipse() from its centre. rectMode() and ellipseMode() change that.
- translate(), rotate() and scale() move the whole grid, not the shape. Wrap each object in pushMatrix()/popMatrix().
- mouseX and mouseY always use plain screen coordinates. To hit-test rotated shapes, convert the mouse position back into the shape’s grid.
- Since Processing 4.4.3, Retina/HiDPI screens default to pixelDensity(2). Loop pixels[] with pixelWidth and pixelHeight.
Fact-checked
We checked these key facts against the sources named, on November 13, 2026:
- According to the p5.js reference, the default WEBGL camera sits at z = 800 (source: p5js.org)
- Issue #1063 adds that some shader() examples misbehave because they relied on pixelDensity(1) (source: github.forks.workers.dev)
- As of November 2026 it is tagged Latest on the processing/processing4 GitHub releases page, with Linux builds dated 23 September 2026 (source: github.com)
- According to the Processing 4 Troubleshooting wiki, since version 4.4.3 sketches automatically use pixelDensity(2) on Retina/HiDPI screens (source: github.com)
- Strokes add a twist: rect(0, 0, width, height) puts its right and bottom edges off-screen, so use rect(0, 0, width-1, height-1) when you want the full border (source: discourse.processing.org)
Processing coordinates in 60 seconds
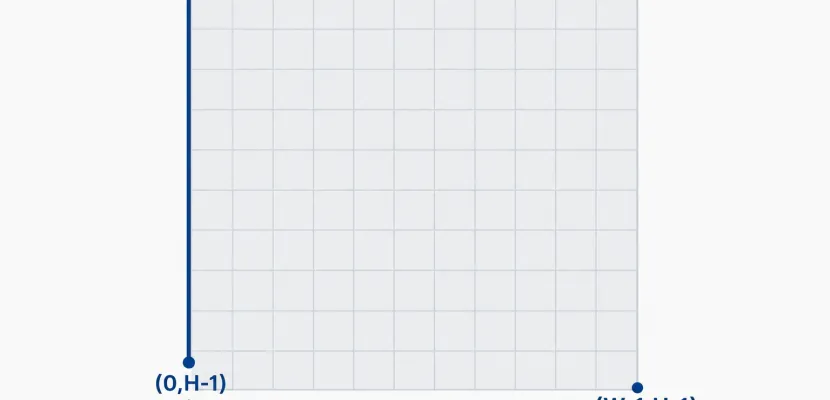
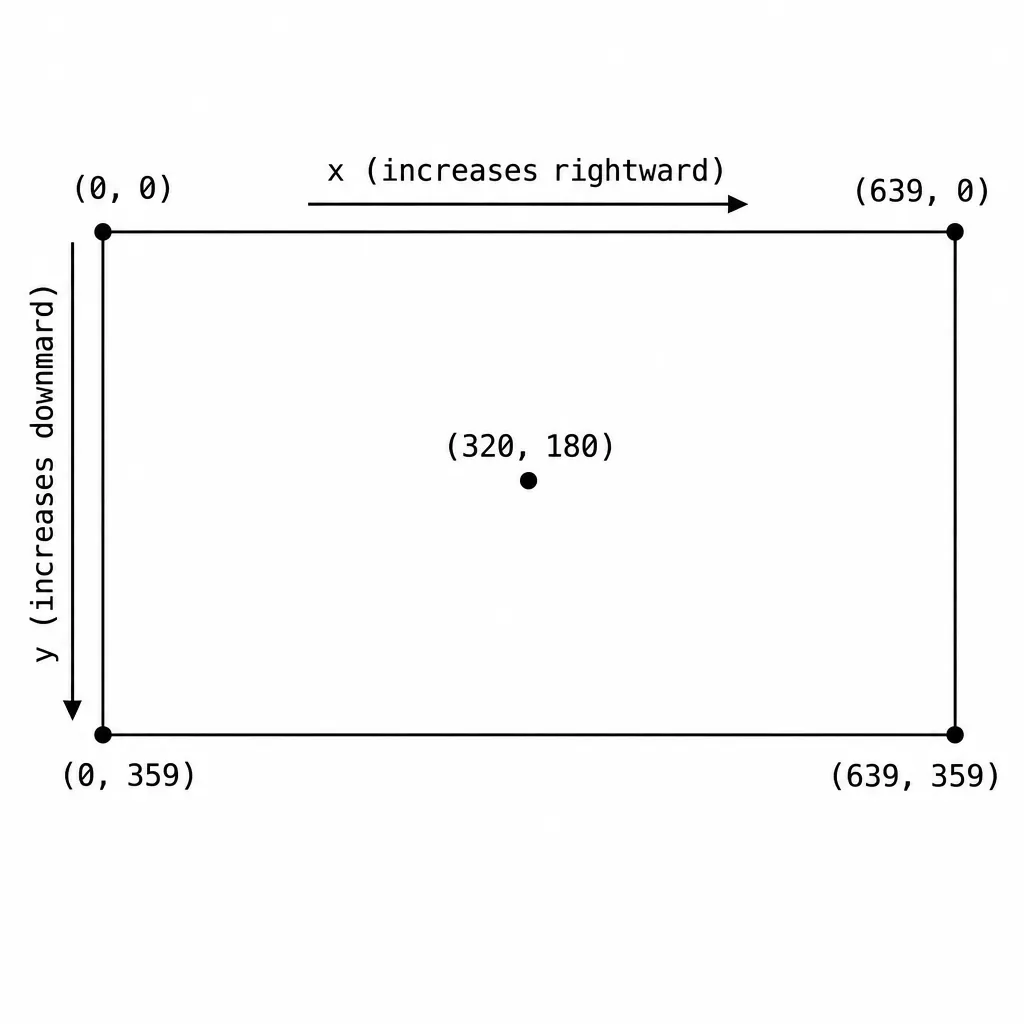
The Processing coordinate system is a grid of pixels with the origin (0, 0) in the top-left corner. x runs from 0 at the left edge to width-1 at the right. y runs from 0 at the top to height-1 at the bottom. Measurements are in pixels unless you transform the grid.
The official Coordinates example on processing.org uses a 640 by 360 window, so the corners look like this:
(0,0) ──────────── +x ───────────▶ (639,0)
  │
  │        (320,180) = (width/2, height/2)
 +y                 •
  │
  ▼
(0,359)                          (639,359) = (width-1, height-1)
Five lines are enough to see it working:
void setup() { size(640, 360); }
void draw() {
  background(255);
  line(0, 0, mouseX, mouseY);              // from the origin to the mouse
  text(mouseX + ", " + mouseY, mouseX + 8, mouseY);
}
Move the mouse to the bottom-right corner and the readout stops at 639, 359. Everything here applies to Processing 4.5.7, the current Processing 4 release. As of November 2026 it is tagged Latest on the processing/processing4 GitHub releases page, with Linux builds dated 23 September 2026. The 4.5 series also brought the redesigned Welcome and Preferences screens that arrived in 4.5.1. The Processing Foundation releases Processing for free on macOS, Windows and Linux.
Why y points down on screens
Displays and image files store pixels in rows, starting with the top row, in the same order you read a page. Graphics libraries number those rows from zero at the top, and Processing (Java mode) uses that convention directly. Your school maths grid puts y up because it describes quantities, not memory. Neither is wrong, but you have to know which one you’re in. A later section shows how to flip it.
Why the last pixel is width-1
Counting starts at 0. A 640-pixel-wide window has pixels 0, 1, 2 … 639, which is 640 positions, so the last one is 639. A point at x = 640 lands just outside the window. Strokes add a twist: rect(0, 0, width, height) puts its right and bottom edges off-screen, so use rect(0, 0, width-1, height-1) when you want the full border.
Studio tip
Write width-1 and height-1, never 499 or 639. The sketch keeps working after you change size(), and you avoid off-by-one bugs at the edges.
Drawing shapes on the grid
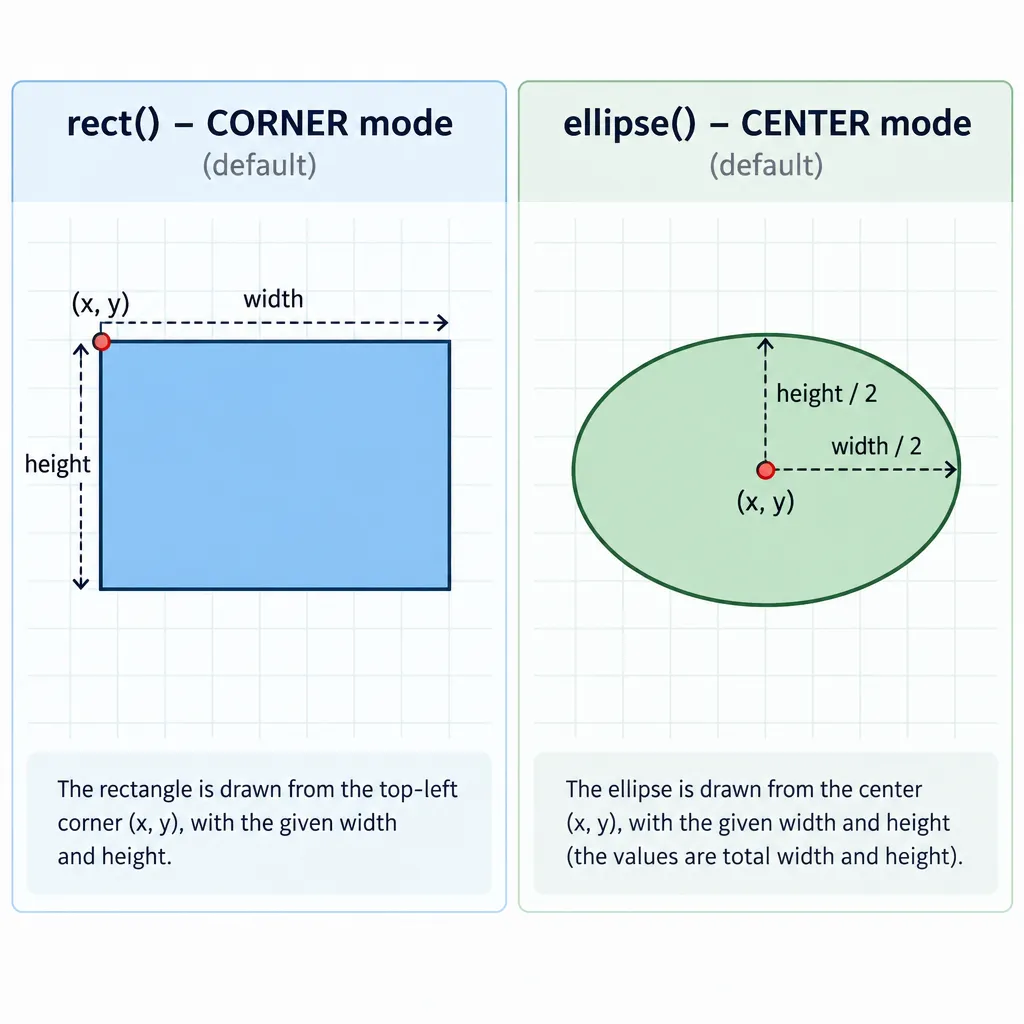
Every shape function takes coordinates on that same grid. What changes is which part of the shape (x, y) refers to. Lines and points use their exact positions. Rectangles use their top-left corner by default and ellipses use their centre.
| Function | Default mode | Arguments | What (x, y) refers to |
|---|---|---|---|
| point(x, y) | none | position | The single pixel location |
| line(x1, y1, x2, y2) | none | two endpoints | Start and end of the line |
| rect(a, b, c, d) | CORNER (rectMode) | x, y, width, height | Top-left corner |
| square(x, y, extent) | CORNER (rectMode) | x, y, side length | Top-left corner |
| ellipse(a, b, c, d) | CENTER (ellipseMode) | x, y, width, height | Centre |
| circle(x, y, extent) | CENTER (ellipseMode) | x, y, diameter | Centre |
| arc(a, b, c, d, start, stop) | CENTER (ellipseMode) | ellipse box plus angles in radians | Centre of the full ellipse |
| triangle(x1, y1, x2, y2, x3, y3) | none | three corners | Each vertex directly |
| quad(x1, y1 … x4, y4) | none | four corners, in order | Each vertex directly |
point() and line()
point(x, y) draws one dot with the current stroke() colour and strokeWeight(). line(x1, y1, x2, y2) joins two points. Neither function uses fill(). Coordinates can be floats: point(10.5, 20) is valid, and because smoothing is on by default, Processing blends it across nearby pixels. The current reference lists smooth() levels of 2, 3, 4 or 8 depending on the renderer. Call noSmooth() once in setup() if you want hard pixel edges for pixel art. That anti alias step is what makes diagonal lines look soft rather than jagged.
rect() and its four modes
rectMode() changes how rect() and square() read their four numbers. The same call, rect(100, 100, 80, 40), lands in a different place in each mode:
| Mode | a, b mean | c, d mean | rect(100, 100, 80, 40) covers |
|---|---|---|---|
| CORNER (default) | top-left corner | width, height | x 100 to 180, y 100 to 140 |
| CORNERS | one corner | the opposite corner | x 80 to 100, y 40 to 100 |
| CENTER | centre | width, height | x 60 to 140, y 80 to 120 |
| RADIUS | centre | half width, half height | x 20 to 180, y 60 to 140 |
The mode constants must be uppercase. Processing reads rectMode(center) as a variable called center and stops with an error.
ellipse() and circle()
ellipseMode() takes the same four constants, but the default is CENTER, so ellipse(100, 100, 80, 40) is centred on (100, 100). In RADIUS mode the third and fourth values become half the width and half the height, which is handy if you think in radii. circle() and arc() follow ellipseMode() too. Use ellipseMode(CORNER) when you want circles to line up with a rect grid, like tiles.
Common mode mix-ups
Three mistakes cause most “my shape is in the wrong place” bugs:
- Mixing defaults. A rect and an ellipse with the same (x, y) won’t share a centre unless you call rectMode(CENTER).
- Modes stick. rectMode() stays in effect for every later frame until you change it. pushStyle()/popStyle(), or push()/pop(), restore it.
- Treating CORNERS as width and height. In CORNERS mode, the third and fourth numbers are a position, not a size.
Stop hard-coding numbers: width, height and normalised coordinates
width and height hold the numbers you passed to size(). If you build a layout from them instead of fixed numbers, the sketch still works when you resize it. That one habit avoids the classic 499-vs-width-1 bug.
Using width/2 and height/2
The processing.org tutorial “Coordinate System and Shapes” is adapted from Daniel Shiffman’s Learning Processing. It draws a creature on a fixed 200 by 200 canvas. Here is a different figure, built so it scales to any size():
void setup() {
  size(400, 400);   // try 200x200 or 600x600: the figure scales with the window
}

void draw() {
  background(255);
  float cx = width / 2;                  // horizontal centre
  float base = height * 0.6;             // body centre sits 60% down
  float u = min(width, height) / 10.0;   // one "unit" = a tenth of the shorter side rectMode(CENTER);
  stroke(0);
  fill(150);
  rect(cx, base, u * 2, u * 4);                   // body
  fill(255);
  ellipse(cx, base - u * 3, u * 3, u * 3);        // head
  fill(0);
  ellipse(cx - u * 0.6, base - u * 3, u * 0.6, u); // left eye
  ellipse(cx + u * 0.6, base - u * 3, u * 0.6, u); // right eye
  line(cx - u * 0.5, base + u * 2, cx - u, base + u * 3); // left leg
  line(cx + u * 0.5, base + u * 2, cx + u, base + u * 3); // right leg
}
At 400 by 400 the unit is 40 pixels, so the body spans y = 160 to 320 and the legs end at y = 360. At 200 by 200 everything halves, and nothing goes off-screen.
map() between ranges
map(value, start1, stop1, start2, stop2) converts a number from one range to another. That’s how you turn data into coordinates. For example, an analog joystick read by an Arduino Uno reports 0 to 1023, and float x = map(reading, 0, 1023, 0, width); puts it on the canvas. Swap the last two values, map(v, 0, 100, height, 0), and bigger values go up the screen, like a chart.
0 to 1 normalised layouts
Many designers place things with fractions: x = nx * width, y = ny * height, where nx and ny run from 0 to 1. A point at (0.25, 0.5) is always a quarter of the way across and halfway down. Generative work often uses this, because noise and random() values in the 0 to 1 range map straight onto the canvas. Normalised coordinates also make it easy to export the same composition at print resolution.
Mouse coordinates
mouseX and mouseY give the cursor’s position in plain screen coordinates, with (0, 0) at the top-left of the sketch window. pmouseX and pmouseY hold the position from the previous frame. These values never respond to translate(), rotate() or scale().
Mirror and kaleidoscope drawing
To mirror a point across the vertical centre line, use width-1-mouseX. To mirror across the horizontal centre line, use height-1-mouseY. Combining both gives four-way symmetry:
void setup() {
  size(640, 360);
  background(255);
}

void draw() {
  if (mousePressed) {
    stroke(0, 60);
    float mx = width - 1 - mouseX,  pmx = width - 1 - pmouseX;
    float my = height - 1 - mouseY, pmy = height - 1 - pmouseY;
    line(pmouseX, pmouseY, mouseX, mouseY);   // your stroke
    line(pmx, pmouseY, mx, mouseY);           // left-right mirror
    line(pmouseX, pmy, mouseX, my);           // top-bottom mirror
    line(pmx, pmy, mx, my);                   // both
  }
}
There’s no background() call in draw(), so the strokes build up. As an exercise, add six-fold symmetry with the rotation technique from the transforms section further down.
Distance and hover tests with dist()
For circles, hover detection is one line: if (dist(mouseX, mouseY, cx, cy) < r). For a rectangle in CORNER mode, check mouseX > x && mouseX < x + w && mouseY > y && mouseY < y + h. Both tests only work if the shape was drawn in untransformed screen space. After a rotate(), you need the fixes in the section on clicking rotated shapes.
Build a coordinate finder sketch (and read XY off any image)
A coordinate finder is a small sketch that shows a crosshair and the live (x, y) under the cursor, and logs each point you click. Load a photo behind it and it also reports the photo’s own pixel coordinates, which is useful for tracing shapes or placing hotspots.
PImage img;                                   // optional backdrop image
ArrayList<PVector> points = new ArrayList<PVector>();

void setup() {
  size(800, 600);
  // img = loadImage("photo.jpg");            // put the file in the sketch's data folder
  textSize(14);
}

void draw() {
  if (img != null) image(img, 0, 0, width, height);  // stretched to fill the window
  else background(240);

  stroke(255, 0, 0, 150);                     // crosshair
  line(mouseX, 0, mouseX, height);
  line(0, mouseY, width, mouseY);

  noStroke();
  fill(0, 120, 255);
  for (int i = 0; i < points.size(); i++) {   // logged points
    PVector p = points.get(i);
    circle(p.x, p.y, 8);
    text(i + ": " + int(p.x) + ", " + int(p.y), p.x + 6, p.y - 6);
  }

  fill(0);
  String readout = "canvas " + mouseX + ", " + mouseY;
  if (img != null) {
    int ix = int(map(mouseX, 0, width, 0, img.width));
    int iy = int(map(mouseY, 0, height, 0, img.height));
    readout += "   image " + ix + ", " + iy;
  }
  text(readout, 10, 20);
}

void mousePressed() {
  points.add(new PVector(mouseX, mouseY));
  println("vertex(" + mouseX + ", " + mouseY + ");");   // paste straight into a sketch
}

void keyPressed() {
  if (key == 'c') points.clear();             // press c to clear
}
Logging clicked points
Each click prints a ready-made vertex(x, y); line to the console. Click around an outline, copy the output, and paste it between beginShape() and endShape(CLOSE) to recreate the shape. Press c to start over.
Loading an image as the backdrop
Uncomment the loadImage() line and drop a file into the sketch’s data folder (Sketch > Add File). The photo is stretched to fit the window, so the sketch shows two readouts. The “canvas” values are window coordinates. The “image” values come from map() and are the photo’s real pixel positions, which you can pass to img.get(ix, iy) to read the colour there. A PImage uses its own grid, which starts at (0, 0) at its top-left corner wherever you draw it.
Make it feel like math class: a centred, y-up Cartesian grid
For a normal Cartesian grid with the origin in the middle and y pointing up, call translate(width/2, height/2); and then scale(1, -1); at the top of draw(). From then on, positive y goes up. The catch is that text and images are mirrored too, so labels need their own flip.
Quick steps: a y-up grid with readable labels
- Call translate(width/2, height/2) to move the origin to the centre.
- Call scale(1, -1) to flip y so it points up.
- Draw axes, lines and curves in math coordinates.
- For each label, wrap it in pushMatrix(), translate to the point, scale(1, -1), call text(s, 0, 0), then popMatrix().
void setup() {
  size(640, 360);
}

void draw() {
  background(255);
  translate(width/2, height/2);   // origin to the centre
  scale(1, -1);                   // y now points up

  stroke(180);                    // axes
  line(-width/2, 0, width/2, 0);
  line(0, -height/2, 0, height/2);

  stroke(0, 90, 255);             // y = x, one unit = one pixel
  line(-160, -160, 160, 160);

  noFill();                       // y = sin(x): 40 px per unit across, 80 px per unit up
  stroke(230, 40, 40);
  beginShape();
  for (float px = -width/2; px <= width/2; px += 2) {
    vertex(px, sin(px / 40.0) * 80);
  }
  endShape();

  fill(0);
  label("y = x", 120, 140);
  label("y = sin(x)", -300, 90);
}

void label(String s, float x, float y) {
  pushMatrix();
  translate(x, y);
  scale(1, -1);                   // flip back locally so text reads correctly
  text(s, 0, 0);
  popMatrix();
}
Flip once, draw text separately
This answers the common forum question about the y flip: how to make y go up without the text turning upside down. Keep the flip for geometry and undo it for each label, as label() does above. You can also draw all text after a popMatrix() that drops the flip, and convert positions by hand. The flip has a side effect too: positive rotate() angles now turn counterclockwise, the same way as in a maths textbook.
Converting a math equation to screen space
If you’d rather not touch the matrix, convert each point yourself. With the origin at the bottom-left, screenY = height - y. With the origin in the centre and a scale of unit pixels per maths unit:
screenX = width/2 + x * unitscreenY = height/2 - y * unit
Worked example on a 640 by 360 canvas with unit = 40: the point (2, 1) lands at screenX = 320 + 80 = 400 and screenY = 180 – 40 = 140. The minus sign is the whole y flip.
Moving the graph paper: translate, rotate, scale
Transforms don’t move shapes. They move the coordinate system the shapes are drawn on. Think of translate() as sliding the graph paper, rotate() as turning it around its current origin, and scale() as changing how big one unit is. Shapes you draw afterwards use the moved paper.
| Function | What it changes | Units | Undo with |
|---|---|---|---|
| translate(x, y) or (x, y, z) | Moves the origin | Pixels in the current grid | translate(-x, -y) or popMatrix() |
| rotate(angle) | Turns the axes around the origin | Radians | rotate(-angle) or popMatrix() |
| scale(s) or scale(sx, sy) | Size of one unit, stroke weight too | Multiplier | scale(1/s) or popMatrix() |
| shearX(angle), shearY(angle) | Slants one axis | Radians | popMatrix() |
| pushMatrix() / popMatrix() | Saves and restores the grid | n/a | Matching pair |
| resetMatrix() | Returns to the plain screen grid | n/a | n/a |
Transforms build up within a frame. Processing resets the grid at the start of every draw(), so each frame begins at the top-left again. Inside one frame, each translate() is relative to the previous one. That’s why a translate() can seem to act “inverted” after a scale(1, -1): translate(0, 50) now moves up.
Order of operations
Order matters because each call works in the grid the previous call left behind. Compare:
translate(200, 0); rotate(QUARTER_PI); rect(0, 0, 50, 50);puts the square’s corner at screen (200, 0), tilted 45°.rotate(QUARTER_PI); translate(200, 0); rect(0, 0, 50, 50);moves 200 pixels along the rotated x axis, so the corner lands near (141, 141).
rotate() always takes radians. Use radians(45), QUARTER_PI, HALF_PI, PI or TWO_PI. A call like rotate(45) turns about 7.2 full circles and looks random. scale() also scales strokes: after scale(4), strokeWeight(1) draws 4-pixel lines, so use strokeWeight(1/4.0) if you want them thin.
Rotating around a shape’s centre or a pivot
rotate() always pivots on the current origin, which starts at the top-left corner. That’s why shapes swing around the corner of the window. To spin a shape on its own centre, move the origin there first:
pushMatrix();
translate(cx, cy);        // origin to the shape's centre
rotate(angle);
rectMode(CENTER);
rect(0, 0, 120, 60);      // draw at the new origin
popMatrix();
To rotate around any pivot (px, py) while still using the shape’s original coordinates, use three steps: translate(px, py); rotate(angle); translate(-px, -py); and then draw as usual. A door hinge, a clock hand or a pendulum all work this way.
Studio tip
To spin a shape around its own centre, translate to the centre, rotate, then draw the shape at (0, 0) with rectMode(CENTER).
pushMatrix()/popMatrix() (push()/pop())
pushMatrix() saves the current grid and popMatrix() restores it. Anything between them is temporary, so one object’s rotation doesn’t affect the next. Processing also has push() and pop(), which save style settings such as fill(), stroke() and rectMode() along with the grid. Every push needs a matching pop. Unmatched calls either leak transforms into later objects or end in a “too many calls to pushMatrix()” error.
Clicking things you rotated: mouse in transformed space
Hover tests fail on rotated shapes because mouseX and mouseY are in screen space while the shape lives in a rotated grid. The fix is to convert the mouse into the shape’s grid using the inverse transform, then run the usual rectangle test. There are three ways to do it.
Inverse transform by hand
For a shape translated to (cx, cy) and rotated by angle, undo the steps in reverse order: subtract the translation, then rotate by the negative angle.
float dx = mouseX - cx, dy = mouseY - cy;
float lx = dx * cos(-angle) - dy * sin(-angle);
float ly = dx * sin(-angle) + dy * cos(-angle);
boolean hover = abs(lx) < w/2 && abs(ly) < h/2;   // for a rectMode(CENTER) shape
Inverting a PMatrix2D
For longer transform chains, build the same steps into a PMatrix2D, invert it and multiply the mouse position by it. Here is a complete rotating button:
float angle = 0;
float cx = 320, cy = 180, w = 160, h = 60;

void setup() {
  size(640, 360);
  rectMode(CENTER);
  textAlign(CENTER, CENTER);
}

void draw() {
  background(250);
  angle += 0.01;

  PMatrix2D m = new PMatrix2D();   // same steps the button uses
  m.translate(cx, cy);
  m.rotate(angle);
  m.invert();                      // now maps screen space into button space
  PVector local = m.mult(new PVector(mouseX, mouseY), null);
  boolean hover = abs(local.x) < w/2 && abs(local.y) < h/2;

  pushMatrix();
  translate(cx, cy);
  rotate(angle);
  fill(hover ? color(255, 120, 60) : color(80, 160, 255));
  rect(0, 0, w, h, 8);
  fill(255);
  text(hover ? "hit" : "hover me", 0, 0);
  popMatrix();
}
screenX(), screenY() and modelX()
The reverse question is “where on screen did this local point end up?” Inside the transform, screenX(x, y) and screenY(x, y) return the screen position of a local point. You can then compare that position with mouseX and mouseY or use it after popMatrix(). In P3D, the Processing reference describes screenX(x, y, z) as projecting a 3D point onto the 2D screen. modelX(x, y, z) instead returns the point’s position after the current transformations, independent of the camera.
Did you know?
The Processing reference notes that modelX() lets you store where a transformed point ended up, so you can still use that position after popMatrix() has reset the grid.
Pixels, pixels[] and HiDPI screens
pixels[] is a flat, one-dimensional array of every pixel in the window, row by row. The pixel at (x, y) is at index = x + y * pixelWidth. On a standard screen pixelWidth equals width. On a Retina or HiDPI screen running Processing 4.4.3 or later, it is double.
Looping over pixels correctly
void setup() {
  size(640, 360);
}

void draw() {
  loadPixels();
  for (int y = 0; y < pixelHeight; y++) {
    for (int x = 0; x < pixelWidth; x++) {
      int i = x + y * pixelWidth;                 // row-major index
      pixels[i] = color(x % 256, y % 256, 160);
    }
  }
  updatePixels();
}
Loops written with width and height still compile on a Retina screen. They only cover part of the array, so the image looks squashed or half-filled. The Processing 4 javadoc says pixelWidth and pixelHeight give the real size of the pixels array, including the 2x density setting. Loaded images are different: a PImage from loadImage() uses its own grid, so index it with x + y * img.width.
Did you know?
According to the Processing 4 Troubleshooting wiki, since version 4.4.3 sketches automatically use pixelDensity(2) on Retina/HiDPI screens. A 640 by 360 sketch then has a 1280 by 720 pixels[] array, four times as many entries as width × height.
The 4.4.3 density change and how to fix old sketches
The change came from pull request #1038, which closed issue #950, “Set default pixel density to the display’s density”, in the 4.4.3 milestone. The Troubleshooting wiki warns that sketches using get(), set() or PDF/SVG export may look different than they did in older versions. Issue #1063 adds that some shader() examples misbehave because they relied on pixelDensity(1). For pixel art, older pixel-loop code, shaders and exact-size exports, call pixelDensity(1); in setup().
| Situation | width/height | pixelWidth/pixelHeight | What to do |
|---|---|---|---|
| Standard 1x display | 640 × 360 | 640 × 360 | Nothing; both work |
| Retina/HiDPI, Processing 4.4.3+ default | 640 × 360 | 1280 × 720 | Loop pixels[] with pixelWidth/pixelHeight |
| pixelDensity(1) forced in setup() | 640 × 360 | 640 × 360 | Use for pixel art, shaders, old sketches |
| PImage from loadImage() | img.width × img.height | same as width/height | Index with img.width |
pixelDensity() can only be called once, right after size() or inside setup(). If you pass it a variable, put the call in settings(). displayDensity() returns 2 on a high-density screen and 1 otherwise, so pixelDensity(displayDensity()); reproduces the new default by hand.
Heads up
Drawing coordinates don’t change with density: a circle at (320, 180) is still centred in a 640 by 360 window. Only pixels[] and the pixel-reading functions see the larger grid.
Polar coordinates for generative art
Polar coordinates describe a point by its distance from a centre (r) and an angle (θ) instead of x and y. Convert with x = cx + r * cos(θ) and y = cy + r * sin(θ). Most radial art uses these: spirals, flowers, clock faces and mandalas.
From (r, θ) to (x, y)
void setup() {
  size(640, 360);
  noStroke();
}

void draw() {
  background(255);
  translate(width/2, height/2);         // the centre becomes (0, 0)
  fill(0);
  for (int i = 0; i < 300; i++) {       // spiral: angle and radius both grow
    float theta = i * 0.2;
    float r = i * 0.55;
    circle(r * cos(theta), r * sin(theta), 4);
  }
  fill(220, 60, 60);
  for (int k = 0; k < 12; k++) {        // radial repetition: 12 evenly spaced dots
    float a = k * TWO_PI / 12;
    circle(170 * cos(a), 170 * sin(a), 10);
  }
}
Because screen y points down, angles increase clockwise on screen, so HALF_PI points straight down. Add a scale(1, -1) to get counterclockwise maths angles. Swap the spiral’s even steps for noise() offsets, and a Perlin noise tutorial is the natural next step for organic radial forms.
atan2 for pointing at the mouse
atan2(dy, dx) goes the other way and returns the angle from one point to another, in radians. float a = atan2(mouseY - height/2, mouseX - width/2); then translate(width/2, height/2); rotate(a); line(0, 0, 100, 0); draws a needle that follows the cursor. Note the argument order: y comes first.
Coordinates in 3D (P3D)
Pass P3D to size(), for example size(640, 360, P3D), to add a z axis. The origin stays at the top-left corner of the z = 0 plane. x still goes right and y still goes down. Positive z comes out of the screen toward you, and negative z goes into the distance.
The z axis and depth
translate(x, y, z) moves the origin in three dimensions, and rotateX(), rotateY() and rotateZ() turn it around each axis. Because y points down, Processing’s axes are left-handed, a mirror image of the right-handed x-right, y-up, z-out convention in most maths books. Rotation order works the same way as in 2D. For a rectangle that rolls on X and pitches on Y, call rotateY(pitch) first and rotateX(roll) second. The roll then happens inside the already pitched frame. The renderer uses depth testing to decide which surfaces hide others.
camera() basics
camera(eyeX, eyeY, eyeZ, centerX, centerY, centerZ, upX, upY, upZ) sets where the eye is, what it looks at, and which axis is up. Called with no arguments, it restores the default view. The default camera sits in front of the window centre and looks at the z = 0 plane, so a flat drawing at z = 0 matches 2D coordinates exactly. The default up vector is (0, 1, 0), which keeps the y-down convention.
Projecting 3D to screen with screenX/screenY
To put a flat 2D label on a 3D object, project a point while it’s transformed, then draw the text after popMatrix():
float a = 0;

void setup() {
  size(640, 360, P3D);
}

void draw() {
  background(20);
  lights();
  pushMatrix();
  translate(width/2, height/2, -200);
  rotateY(a);
  rotateX(a * 0.7);
  noStroke();
  fill(0, 150, 255);
  box(120);
  float sx = screenX(60, -60, 60);   // one corner of the box, projected to 2D
  float sy = screenY(60, -60, 60);
  popMatrix();
  fill(255);
  text("corner", sx + 8, sy);        // drawn in plain screen space
  a += 0.01;
}
Plotting real-world coordinates (latitude/longitude) in a sketch
The simplest way to map GPS data is an equirectangular layout: longitude (-180 to 180) maps to x and latitude (90 to -90) maps to y. Latitude has to be reversed because north is up on a map but y grows downward on screen.
Equirectangular mapping with map()
float[][] cities = { {51.5074, -0.1278}, {40.7128, -74.0060},
                     {35.6762, 139.6503}, {-33.8688, 151.2093} };
String[] names = {"London", "New York", "Tokyo", "Sydney"};

void setup() {
  size(720, 360);                       // 2:1, matching 360° by 180°
}

void draw() {
  background(230, 240, 255);
  for (int i = 0; i < cities.length; i++) {
    float lat = cities[i][0], lon = cities[i][1];
    float x = map(lon, -180, 180, 0, width);
    float y = map(lat, 90, -90, 0, height);   // reversed: north at the top
    fill(200, 0, 0);
    circle(x, y, 8);
    fill(0);
    text(names[i], x + 6, y - 6);
  }
}
With a 2:1 canvas, every degree has the same width in both directions. To place points on a background map image, the image must use the same equirectangular projection and cover the same bounds.
WGS84 vs UTM in one paragraph
GPS devices and most open datasets give positions as WGS84 latitude and longitude in degrees, sometimes labelled EPSG:4326. That’s what the map() approach above expects. UTM is a projected system that splits the world into 60 zones, each 6° of longitude wide, and gives positions in metres within a zone. It suits city-scale sketches where distances matter. Web maps mostly use Web Mercator (EPSG:3857), which stretches high latitudes, so convert with a projection formula, not a straight map(), if you need to line up with tiles.
Processing vs p5.js vs py5 vs MATLAB vs math class
Most creative coding tools share the top-left origin with y pointing down, but there are traps when you switch. The biggest are p5.js WEBGL, where the origin moves to the centre, and MATLAB, where indices start at 1 and come in (row, column) order.
| Tool / mode | Origin | +y direction | Index base / order | Grid save/restore |
|---|---|---|---|---|
| Processing (Java mode), default and P2D | Top-left | Down | 0-based, pixels[x + y*pixelWidth] | pushMatrix()/popMatrix(), push()/pop() |
| Processing P3D | Top-left at z = 0, +z toward viewer | Down | 0-based | Same as above |
| p5.js 2D canvas | Top-left | Down | 0-based, 4 array entries (RGBA) per pixel | push()/pop() |
| p5.js WEBGL | Centre of canvas (0, 0, 0) | Down | 0-based | push()/pop() |
| py5 (Python) | Top-left | Down | 0-based | push_matrix()/pop_matrix(), push()/pop() |
| MATLAB images | Upper-left; intrinsic corner at (0.5, 0.5) | Down (rows) | 1-based, (row, column) | n/a |
| Math class Cartesian | Where the axes cross | Up | n/a | n/a |
py5 and the older Processing.py (Python Mode) wrap the same Java core, so the grid is identical. Only the naming style differs. Processing, p5.js and py5 are all free and open source. MATLAB is a commercial MathWorks product. According to the p5.js reference, the default WEBGL camera sits at z = 800. To port a top-left 2D layout into p5.js WEBGL, start draw() with translate(-width/2, -height/2).
Studio tip
Wrap every self-contained transformed object in pushMatrix()/popMatrix() (push()/pop() in p5.js and Processing 4) so its transforms don’t leak into the next object.
Coordinate bugs and quick fixes
Most coordinate bugs come from one of three things: a hard-coded number, a transform that leaked, or mixing screen space with a transformed grid. Find your symptom here.
| Symptom | Likely cause | Fix |
|---|---|---|
| Shape off-screen or clipped at the right/bottom | Numbers written for a different size(), or a stroke at x = width | Use width/height fractions; draw edges at width-1, height-1 |
| Text upside down | Drawn after scale(1, -1) | Flip locally: translate, scale(1, -1), text at (0, 0) |
| Shape swings around the window corner | rotate() pivots on the origin | translate() to the shape’s centre first, draw at (0, 0) |
| Shape spins wildly or jumps | Degrees passed to rotate() | Use radians(deg) or PI constants |
| Hover works until the shape rotates | mouseX/mouseY are screen space | Inverse transform, PMatrix2D.invert() or screenX() |
| Objects drift or pile up | Missing popMatrix() | Pair every push with a pop |
| Thick strokes after scale() | Strokes scale with the grid | Divide strokeWeight by the scale factor |
| pixels[] image half-filled on a Retina Mac | Loop uses width/height, density is 2 | Loop with pixelWidth/pixelHeight or call pixelDensity(1) |
| Shader or get() output looks wrong since 4.4.3 | Code relied on density 1 | Add pixelDensity(1) in setup() |
| p5.js sketch shifted after switching to WEBGL | Origin moved to the centre | translate(-width/2, -height/2) at the top of draw() |
FAQ
Where is (0,0) in Processing?
At the top-left corner of the sketch window. x increases to the right and y increases downward. The bottom-right pixel is (width-1, height-1).
Why is the y axis upside down in Processing?
It isn’t upside down, it follows the screen convention. Displays and image memory store rows from the top, so row 0 is the top line and bigger y values go down. A maths grid puts y up because it describes quantities, not pixel rows.
How do I move the origin to the centre of the screen in Processing?
Call translate(width/2, height/2) at the start of draw(). Every later coordinate is measured from the centre, so (0, 0) is the middle of the window and negative x and y are valid.
How do I flip the y axis so up is positive?
After the translate(), add scale(1, -1). Geometry now uses maths orientation. For text, flip back locally with pushMatrix(), translate(x, y), scale(1, -1), text(s, 0, 0), popMatrix(). If you prefer no transforms, use screenY = height/2 – y * unit.
What is the difference between rectMode(CENTER) and rectMode(CORNER)?
In CORNER mode, the default, rect(x, y, w, h) places the top-left corner at (x, y). In CENTER mode, the same call centres the rectangle on (x, y). The width and height mean the same thing in both modes.
How do I get mouse coordinates after translate() or rotate()?
mouseX and mouseY stay in screen space. Convert them into the transformed grid: subtract the translation, then rotate by the negative angle. Or rebuild the transform in a PMatrix2D, call invert() and multiply the mouse position by it.
What do pushMatrix() and popMatrix() do?
pushMatrix() saves the current coordinate system and popMatrix() restores it. Transforms between them affect only what you draw in that block. push() and pop() do the same and also save style settings.
What do screenX() and modelX() do?
screenX(x, y) or screenX(x, y, z) returns where a point in the current transformed grid lands on the 2D screen, so you can compare it with the mouse. In P3D, modelX(x, y, z) returns the point’s position after transformations, independent of the camera, which lets you reuse that position after popMatrix().
Why does my pixels[] loop break on a Retina/HiDPI screen?
Since Processing 4.4.3, HiDPI screens default to pixelDensity(2), so pixels[] holds pixelWidth × pixelHeight entries, four times width × height. Loop over pixelWidth and pixelHeight, or call pixelDensity(1) in setup() to get the old behaviour.
How does the z axis work in Processing P3D?
With size(w, h, P3D), z = 0 is the plane of the window. Positive z comes toward the viewer and negative z goes away. The origin stays top-left and y still points down. translate(x, y, z), the rotateX/Y/Z functions and camera() all work on that grid.
Try it live
Once you can switch between screen space and a shape’s own grid, almost every coordinate bug in this guide becomes easy to fix. The sketch below runs in p5.js, which uses the same top-left grid as Processing. It shows a live crosshair and readout, logs every click, and has a rotating button with a working hover test. Press G to switch the readout to a centred, y-up grid, and C to clear the logged points.
// Coordinate explorer: crosshair, live readout, click logging,
// a math-grid toggle and a rotating button with correct hover detection.
let angle = 0;
let mathGrid = false;   // G toggles screen coordinates vs centred y-up coordinates
let clicks = [];

function setup() {
  createCanvas(640, 360);
  textFont('monospace');
  textSize(13);
}

function draw() {
  background(250);
  drawGrid();

  // The button lives in its own rotated grid, centred at (440, 180)
  const cx = 440, cy = 180, w = 140, h = 50;
  angle += 0.01;

  // Inverse transform: move the mouse into the button's local grid
  const dx = mouseX - cx;
  const dy = mouseY - cy;
  const lx = dx * cos(-angle) - dy * sin(-angle);
  const ly = dx * sin(-angle) + dy * cos(-angle);
  const hover = abs(lx) < w / 2 && abs(ly) < h / 2;

  push();
  translate(cx, cy);
  rotate(angle);
  rectMode(CENTER);
  stroke(30);
  fill(hover ? color(255, 120, 60) : color(80, 160, 255));
  rect(0, 0, w, h, 8);
  noStroke();
  fill(255);
  textAlign(CENTER, CENTER);
  text(hover ? 'hit!' : 'hover me', 0, 0);
  pop();

  // Points you clicked, labelled in the current coordinate style
  noStroke();
  textAlign(LEFT, BOTTOM);
  for (const p of clicks) {
    fill(0);
    circle(p.x, p.y, 6);
    text(label(p.x, p.y), p.x + 5, p.y - 3);
  }

  // Crosshair through the mouse
  stroke(220, 0, 0, 120);
  line(mouseX, 0, mouseX, height);
  line(0, mouseY, width, mouseY);

  // Readouts
  noStroke();
  fill(0);
  textAlign(LEFT, TOP);
  text('mouse ' + label(mouseX, mouseY), 10, 10);
  text('button-local (' + nf(lx, 1, 1) + ', ' + nf(ly, 1, 1) + ')', 10, 28);
  if (mathGrid) {
    text('G: math grid, origin centre, y up', 10, height - 22);
  } else {
    text('G: screen grid, origin top-left, y down', 10, height - 22);
  }
}

// Format a screen position in whichever coordinate system is active
function label(x, y) {
  if (mathGrid) {
    return '(' + round(x - width / 2) + ', ' + round(height / 2 - y) + ')';
  }
  return '(' + round(x) + ', ' + round(y) + ')';
}

// Light 20 px grid plus the axes for the active system
function drawGrid() {
  stroke(235);
  strokeWeight(1);
  for (let x = 0; x < width; x += 20) line(x, 0, x, height);
  for (let y = 0; y < height; y += 20) line(0, y, width, y);
  stroke(120);
  strokeWeight(3);
  if (mathGrid) {
    line(width / 2, 0, width / 2, height);
    line(0, height / 2, width, height / 2);
  } else {
    line(0, 0, width, 0);
    line(0, 0, 0, height);
  }
  strokeWeight(1);
}

function mousePressed() {
  clicks.push(createVector(mouseX, mouseY));
  print(label(mouseX, mouseY));   // also logged to the console
}

function keyPressed() {
  if (key === 'g' || key === 'G') mathGrid = !mathGrid;
  if (key === 'c' || key === 'C') clicks = [];
}
On this article
- Facts were checked against the sources below before publication.
- Published
Sources (8)
- Releases · processing/processing4 (GitHub) (github.com)
- Troubleshooting · processing/processing4 Wiki (github.com)
- Pixel Density Changes · processing/processing4 Wiki (github.com)
- Set default pixel density to the display's density · Issue #950 (github.com)
- processing4 Pull Request #1038 (github.com)
- Shader examples and pixel density · Issue #1063 (github.com)
- displayDensity() / Reference / Processing.org (processing.org)
- PImage (Processing core javadoc) (processing.github.io)